%20(1).svg)

What is learning analytics?
Learning analytics is the measurement, collection, analysis, and reporting of data about learners and their contexts, used to understand and improve learning and the environments in which it happens. In practice, learning analytics means taking the data your LMS already generates — logins, course progress, assessment scores, time on task — and turning it into decisions: which learners need support, which courses need fixing, and whether training is actually working.
The terms learner analytics and learning analytics are used interchangeably; both describe the same discipline of using learner data to improve outcomes. What separates learning analytics from simple reporting is intent: reports describe what happened, while analytics exists to change what happens next.
Learning analytics vs LMS analytics vs eLearning analytics
You will see several near-synonyms used across the industry, and they differ mainly in scope. LMS analytics (or learning management system analytics) refers specifically to the data captured inside your LMS platform. eLearning analytics covers digital learning data wherever it lives, including tools outside the LMS. Learning ecosystem analytics is the widest lens, combining LMS learning analytics with HR, CRM, and business systems to connect learning to organizational results.
The distinctions matter when you choose tooling: built-in LMS analytics answer course-level questions, while ecosystem-level analysis usually requires a dedicated platform or data warehouse.
The four types of learning analytics
LMS analytics comes in various forms, each serving a unique purpose. Understanding these types can enhance educational strategies by leveraging the right data tools.
Descriptive analytics is the first step in understanding raw data. It answers the "what happened" question by summarizing past student performance and engagement.
Diagnostic analytics delves deeper to explain why certain outcomes occurred. This analysis identifies patterns and points out potential causes for learner behavior.
Moving forward, predictive analytics offers foresight into potential future outcomes. It uses statistical models to forecast how students might perform based on current trends.
Prescriptive analytics takes it a step further by suggesting actionable steps. It not only predicts future scenarios but also recommends interventions to optimize learning paths.
The types of LMS analytics include:
- Descriptive: Summarizes past data
- Diagnostic: Explains reasons behind outcomes
- Predictive: Forecasts future performance
- Prescriptive: Recommends actionable strategies
Predictive analytics can alert educators to students at risk of falling behind. This proactive approach helps in designing timely interventions.
Meanwhile, prescriptive analytics assists educators in refining their instructional tactics. By suggesting improvements, it supports personalized and adaptive learning.
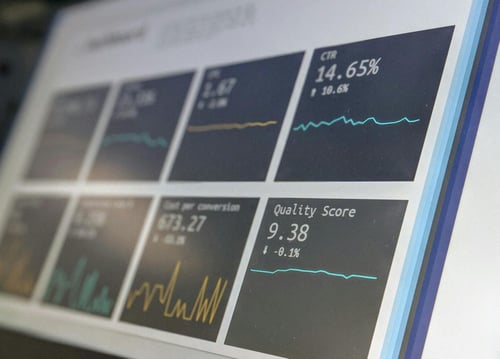
These analytics types, when used together, provide comprehensive insights. They empower educators to make informed decisions that enhance both teaching methods and student learning outcomes. Embracing all types of analytics can lead to a more robust educational experience.
Key metrics and data points to track
Key metrics within LMS analytics offer vital insights into learner progress and engagement. They are essential for personalizing education and improving course delivery. Understanding these metrics allows educators to tailor their strategies effectively.
One of the primary metrics is learner progress. It tracks how far students have advanced in their courses. Completion rates provide a clear indication of student commitment and success.
Another significant data point is assessment performance. This includes scores and grades on quizzes and exams. Analyzing these results helps identify areas where students excel or struggle.
Engagement metrics are equally important. They measure time spent on various activities. These can include video views, reading assignments, and interactive content.
Key metrics include:
- Learner progress and completion rates
- Assessment scores and quiz results
- Time spent on coursework and activities
Interaction data reveals how learners communicate. This includes participation in forums and group discussions. It helps assess collaborative learning outcomes.
Usage patterns give insights into popular resources. Knowing which materials are frequently accessed aids in resource optimization. Customizing content based on usage can improve learning.
Essential data points involve:
- Discussion forum activity
- Resource access and content popularity
- Communication patterns among learners
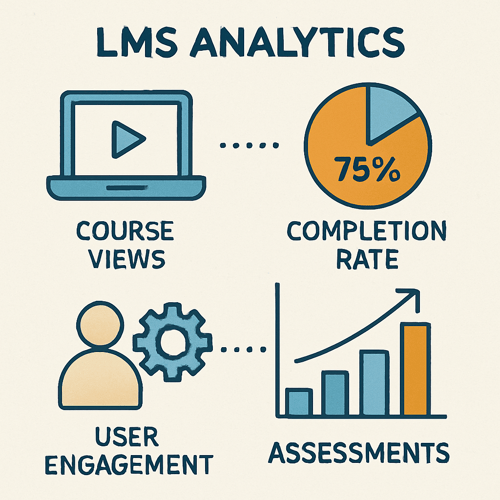
By focusing on these key metrics, educators can address diverse learning needs. This ensures that instruction is relevant, engaging, and effective for all students.
Learning analytics in education and higher ed
Learning analytics in education began in universities, where data analytics for LMS in higher education is now used to flag at-risk students weeks before a failing grade appears, personalize pathways, and optimize course design across large cohorts. Colleges use data analytics to optimize LMS deployments at institutional scale — connecting LMS assessment data with academic analytics systems to improve retention.
For a deeper look at how institutions apply this, see our guide to the 5 types of analytics used in higher education.
The art and science of using learning data
EDITORIAL REVIEW — no heading matched ['art', 'science', 'qualitative', 'interpret'] in learning-analytics-art-and-science-of-using-data-in-elearning; full source body inserted below - trim to the relevant part
- 5 MIN READ -
From a deep dive into Impressionist artists to mastering content management systems like Drupal, eLearning has exponentially expanded how everyone from high school students to retirees gains knowledge of a multitude of subjects. eLearning’s growing footprint ranges from businesses helping employees build new skills to online universities to the general public thirsty to learn something new, such as rudimentary French before a trip to Paris.
At the same time, the enormous amount of data generated by eLearning can teach those who administer the programs a lot about such things as login frequency, time spent on online resources, completion rates and preferred user devices. In turn, this information can be used to better shape eLearning offerings to improve user experience and meet their needs.
We know a thing or two about the importance of learning analytics for eLearning businesses, that’s why we built the award-winning Lambda Analytics. If you’ve got big data questions, we’ve got answers!
The Rise of eLearning
Data about eLearning paints a picture of rapid growth. According to a 2019 Global Market Insights, Inc. report, the worldwide market for eLearning is expected to rise from $190 billion in 2018 to $300 billion in 2025. The eLearning market in North America accounts for about 40% of the global market. Demand for cost-effective training and learning in both corporate and academic arenas are expected to drive the growth.
Businesses are choosing cloud-based Learning Management Systems (LMS) today because they offer greater flexibility in terms of accessibility and storage of content. Cloud-based administrative systems on the whole also offer improved security and data backup options. Another trend is accessing eLearning on mobile devices.
Data from Global Analysts Inc. suggests profits increase when employers utilize eLearning. They report that when companies spend $1,500 per employee each year on eLearning, profit margins increase by about 24%.
If you’ve ever wondered, “What is an eLearning Business?”, this free eBook is your guide to the opportunities in this 200-million-dollar industry. Snag your copy right here!
Data Improves eLearning Programs
Data generated by eLearning systems can offer insights into how to enhance the experience for learners and build businesses. But to be useful, the data has to be analyzed. Start with gathering everything that’s been generated from the courses you offer, such as website stats, eLearning course analysis, learning management system analytics, grades, student reviews and social media.
Then determine a few key goals that you’d like the data to help with. For example, you might want to find out if a course offers enough challenges and learning opportunities. You will want to look for trends and patterns that become apparent after analyzing the data. If it looks like many students are zooming through the material and still acing the quizzes at the end of a section, your offering might be too easy and not imparting enough new information. On the other hand, one that is over students’ heads may lead them to abandon the course early on.
Data from individual students can help design personalized learning. Artificial intelligence (AI) can analyze student strengths and weaknesses as they complete courses and recommend new ones that will help fill any holes.
Surveys from users who have finished a course can also be very helpful. You may have thousands of these surveys piled up on your server. The data you can mine from them will be useful in finding areas for improvement or new directions for future course modules.
Sounds like a lot of work, doesn’t it? With the right tools and know-how, Analyzing lesson activity data to build better eLearning can be a snap. We cover both in this informative on-demand webinar, check it out!
The Human Factor
As you look at all this aggregated data, remember that computers can only take you so far. There’s an art to using this information to make decisions only humans can make. An analytics program can tell you how long students spent on a certain module, but you are the one who needs to parse out why and if that needs improvement.
You can marry this knowledge with an understanding of the general characteristics of those involved with a particular eLearning course. Your Millennial learners (born from 1980 to 1996), for example, have a learning style that appreciates a user experience involving easy navigation, feedback opportunities and personalization. On the other hand, they may not respond as well to programs they perceive to move too slowly or are hard to use.
Data Options and Safety
No matter what, all of the data collected in this process is simply useless without proper data science and analytic practices. Does the job of figuring out what to do with it all stymie you? There are—yes—eLearning courses that can help, as well as data and business analyst degree programs that can give you or an employee entry into an in-demand career like financial analyst.
In the meantime, it’s possible to outsource all the data crunching. Big data consultants abound, and they can help you monitor and analyze the information you have. They can be costly, but you may be able to get a good return on your investment if they can find ways to improve your offerings and identify trends you hadn’t noticed.
Don’t tell the data analysts, but we’ve got a not-so-secret solution to the analysis problem: the award-winning Lambda Analytics and this webinar covering the Top 5 Tips for Keeping Reporting Simple
Of course, if you think this data is valuable, so might hackers. It’s important to encrypt data sources to keep them safe, including the personal information of your learners. To help ensure privacy and data protection, it’s best to entrust a few key employees to use the data rather than having open access to everyone at your company.
Because it’s online or in the cloud, eLearning can create a wealth—and sometimes overwhelming—amount of data to sift through. But by carefully setting parameters of what questions you’d like to answer, data can provide insights into how your students are learning today and what innovations they will need down the road.
Disclaimer: This article was contributed by guest blogger Beau Peters. Beau is a creative professional with a lifetime of experience in service and care. As a manager, he's learned a slew of tricks of the trade that he enjoys sharing with others who have the same passion and dedication that he brings to his work. The views and opinions expressed belong to the guest blogger alone, and do not necessarily reflect the official policies or opinions of Lambda Learning.
How to use LMS reporting and analytics effectively
To make the most of LMS reporting and data analytics, it's crucial to start with clear objectives. Define what you want to achieve with data insights.
Begin by selecting the right metrics that align with your goals. Focus on data that contributes directly to learning improvements.
Use data visualization tools within your LMS for better understanding. These tools help translate data into actionable insights through graphs and charts.
Consider leveraging customizable reports to emphasize specific areas of interest. Personalized reports support targeted strategies for educational enhancement.
Steps for Effective Use:
- Identify clear objectives for using LMS analytics.
- Select key metrics relevant to these goals.
- Use visualization tools for data clarity.
When analyzing data, involve educators, IT specialists, and administrators. Collaboration enhances interpretation and strategic decision-making.
Key Practices:
- Regularly review analytics to track progress.
- Encourage a data-driven culture among educators.
- Integrate findings into curriculum development.

Real-time data access in LMS systems supports prompt educational interventions. These insights are invaluable for adapting teaching methods to current learner needs. As you explore LMS analytics, remember the potential for continuous improvement in educational practices. By effectively using reporting tools and analytics, educators can optimize learning outcomes with informed, strategic actions.
Learning analytics platforms and software
A dedicated learning analytics platform extends what built-in LMS reports can do: cross-course dashboards, scheduled reporting, custom data models, and the ability to join learning data with business data. When evaluating learning analytics software, look for direct LMS integration, self-serve report building for non-analysts, xAPI support, and export options that keep your data yours. The learning analytics market has consolidated around platforms that embed directly into the LMS experience.
If you run Moodle or Totara, Zoola Analytics provides exactly this layer — ad hoc reporting, dashboards, and scheduled delivery on top of your LMS data.
xAPI and learning analytics
xAPI analytics extends learning measurement beyond the LMS: the Experience API captures learning statements from simulations, mobile apps, and on-the-job activities into a Learning Record Store, where they can be analyzed alongside LMS data. Read our full explainer on what xAPI and LRS are and how they support analytics and reporting.
Learning analytics FAQ
What are the four types of learning analytics?
Descriptive (what happened), diagnostic (why it happened), predictive (what will happen), and prescriptive (what to do about it). Most organizations start with descriptive reporting and mature toward predictive and prescriptive use.
What data does an LMS collect?
Typical LMS learning analytics data includes enrollments, logins, course and activity completion, time spent, assessment scores and attempts, forum activity, and certification status.
Is learning analytics only for education?
No — corporate L&D teams use the same methods to measure onboarding speed, compliance completion, and the business impact of training.
EDITORIAL REVIEW — winner content not claimed by any section - keep, move, or delete
If you’ve been nodding along in data analysis meetings while secretly Googling ‘What is learning analytics?’ under the desk, this article’s for you.
Contents:
 (Source: Undraw)
1. What is learning analytics?
Defining analytics
There are a whole bunch of ways to define analytics. Here’s a simple, general definition:
Learning analytics is about collecting traces that learners leave behind and using those traces to improve learning.
This is a nice definition of analytics for education, partly because it uses plain English, but also because it alludes to the cyclical nature of the analytics process.
By running pattern-producing algorithms on past work, it’s possible to highlight pressure points, spikes in performance, and areas of unusual change in your eLearning course. This supports better targeting of resources so that designers, admins, or instructors can make focused refinements to learning content—before the data-gathering stage begins again.
It makes sense to start at the beginning. So if you’re new to analytics and want to dive right in, this free eBook is for you - LMS 101: Learning Analytics.
Reporting
When organizations talk about data analytics, they’re usually talking about reporting. Reporting tools, such as Lambda Analytics, are the platform through which most people access analytics on the daily.
Reports are visual or statistical descriptions of some aspect of your analytics data set. They can be created for nearly any purpose—most often to demonstrate an insight that a data analyst has found while experimenting with your data set, or to update people on useful learning metrics.
For example, you might receive a bi-weekly analytics report on the most and least popular content, highest and lowest attainment in quizzes, time spent learning, or which courses are being fully completed.
This makes analytics reports a great way to shed light on exactly what learners are doing, giving educators, administrators, HR, and wider stakeholders insights into the reality of learning inside your institution.
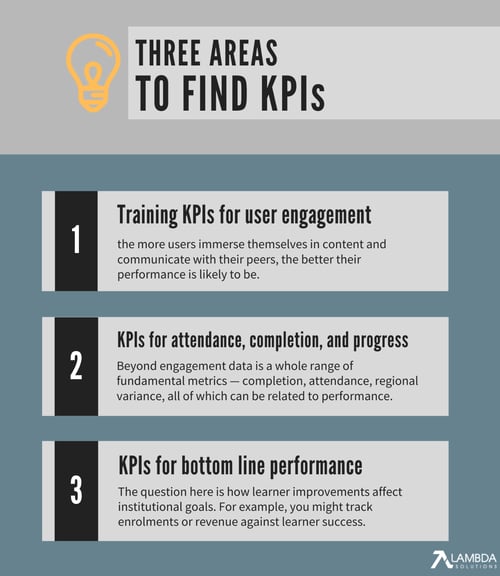
Key Performance Indicators (KPIs)
To translate data from its raw state into a persuasive story about how learning is (and should be) happening on a course, data analysts need to develop a set of metrics by which to measure performance.
Key Performance Indicators are the term for these measurements, which can be applied to reports and other analytics outputs. The exact KPIs you need will depend on the overall objectives of your organization, as well as the data question that’s being asked.
Typical examples of KPIs include:
- Pass/fail rates
- Applications and acceptance rates
- Student satisfaction percentage
- Student/faculty ratio
- Departments within budget
- Freshmen retention
For instance, you might be interested in whether analytics data supports recent changes you’ve made to your enrollment process. To answer this data query, you can use your analytics platform’s filters to develop a KPI, then run a series of reports that demonstrate progress in that area.
A good way to keep analytics reporting simple is to develop reports based on a single set of KPIs. For other tips on efficient reporting, watch our definitive webinar: Top 5 Tips for Keeping Reporting Simple.
2. Why do people keep talking about ‘Big Data’?
| Big Data often conjures the idea of thousands of data points forming pleasing-looking patterns, such as this map of 2015 Thanksgiving flights by Google (Source: GoogleTrends). |
What’s so ‘big’ about it?
You probably won’t get far in a conversation about analytics in education before somebody brings up the concept of Big Data.
The idea of Big Data derives from the long digital trails we leave behind us as we go about our daily online business. Almost every interaction a user has with a learning management system (or other educational space) leaves some kind of footprint—think logging on and off, browsing activities, completing quizzes—which, across a whole student body, aggregates to a lot of digital traces being left behind.
The term is often attributed to any large data set, but for data to be truly ‘big’, the set should be at least one terabyte (TB). With the average day in 2020 producing around 2.5 quintillion bytes of information (that’s up to 1.7MB of data created per second for every person on earth), producing enough data clearly isn’t a problem.
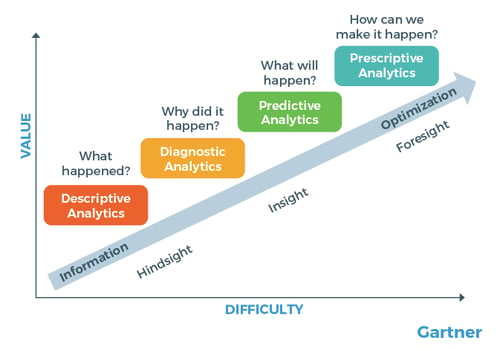 |
| Today, many educational organizations can use analytics to predict performance, as well as learn from past work (tbmcg.com). |
Predictive analytics
Predictive analytics takes the power of Big Data and uses it to focus on the future. This is a change for many people in the training and education industry, who will mostly encounter retrospective analytics—looking at what’s already happened.
The information held within Big Data means that today, analytics speaks not only on past performance, but can give insights into future behaviour, too.
According to most industry experts, learning analytics can now be divided into four phases:
- Descriptive analytics—using data analysis to tell a story of past performance.
- Diagnostic analytics—using data to answer questions about why things happened as they did.
- Predictive analytics—using Big Data to follow trends, and suggest what is likely to happen next.
- Prescriptive analytics—using Big Data and complex simulations to answer questions about what the next steps taken should be.
With the right resources and enough time to explore such large data sets, predictive analytics can yield impressive results. For example, using their analytics engine, IBM AI can predict with 95 percent accuracy which employees will quit their job!
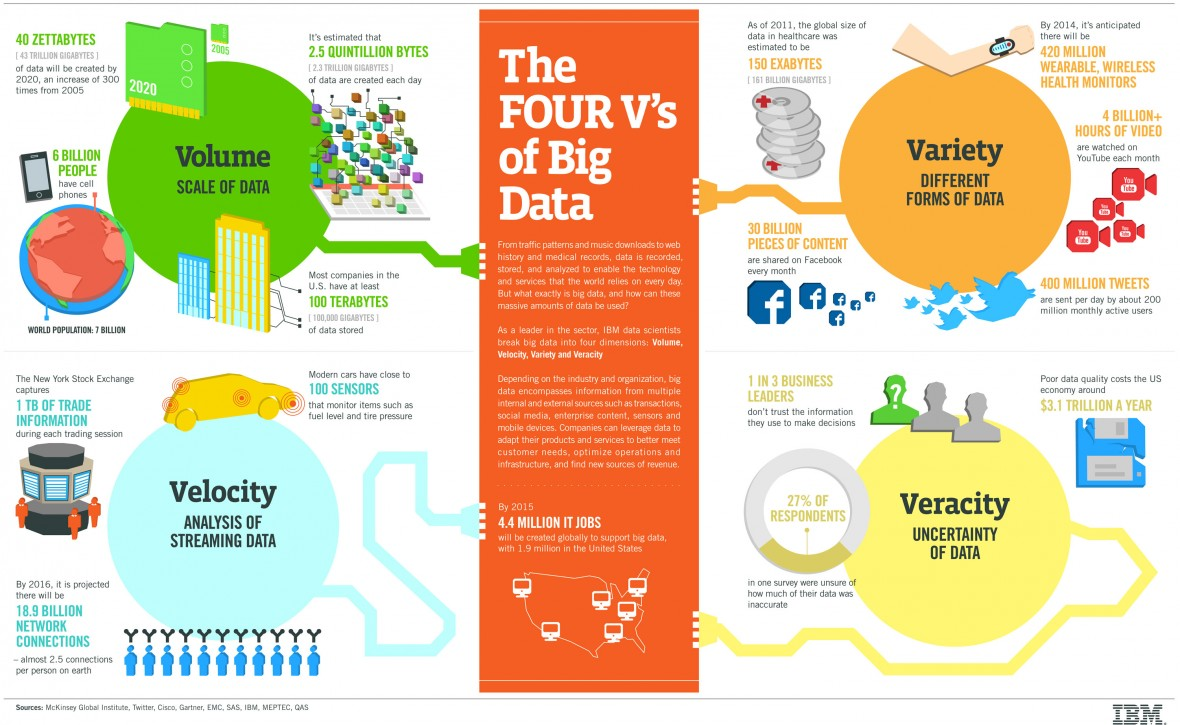 |
| IBM’s description of the volume, variety, velocity and veracity of information offered by Big Data (Infographic: The Four V's of Big Data). |
3. Analytics in education and eLearning
Why should I care about data analysis in education?
Ok, so it’s probably true to say that your organization doesn’t offer IBM-levels of analytics resources. But that doesn’t mean that education institutions are insulated from the growing integration of data into everyday life.
Tomorrow’s learners (and many of today’s) expect a personal learning environment—where lesson content, and the delivery of that content, is tailored specifically to their needs and preferences, based on their learner data footprint.
Likewise, the next generation of training professionals is far more likely to make use of tools allowing them to identify trends in their classes—taking an analytical approach to grades, learning objectives, and learner engagement.
The truth is that analytics in education has been around for a fair amount of time already. In the mid-2000s, Purdue University introduced an analytics-driven traffic light system, which gave educators an instant visual snapshot of student progress.
More fundamentally, basic analytics has been used for decades at the exam level, where SAT and other test results are analyzed, not by looking qualitatively at the entire learning process, but through overall trends and summative snapshots of what has been learned.
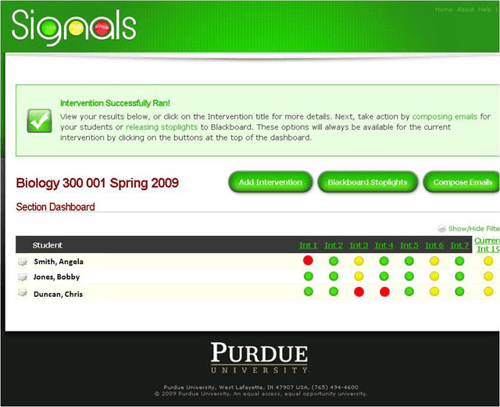 |
| Purdue’s early forays into analytics in education (Source: Educause Review) |
Gap analyses
Perhaps the simplest way that analytics and education come together is through closing skills gaps.
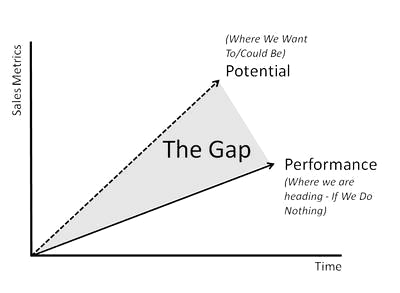
You may be familiar with gap analyses as a tool for reviewing the difference between performance and potential—either for an individual or an organization.
It’s an effective way of asking questions about productivity and comprehension: how well do your learners understand their objectives, and how often do they actually meet them?
This kind of task is a perfect use of learner analytics. Identifying a skill gap is all about measuring an entity's ability to meet objectives, which—as we’ve seen above—is pretty much synonymous with developing a set of KPIs and running reports to find out how closely those objectives are being met.
 |
| The gap between potential and actual market standing (marketing91.com). |
MUST-READ!—What does analytics mean for my eLearning business?
This is where the rubber really hits the road with learner analytics. If your organization invests at all in eLearning—or if you run eLearning as a business—analytics will help you develop your return on investment (ROI).
How? Well, let’s look at the wider picture of eLearning in education and training over the past decades.
Interestingly, the rise in analytics-based course design has coincided with a fall in the amount of resources organizations are spending on training their employees.
From 1979 to 1995, for example, the average amount of time a worker spent in formal training allocated to training fell from 2.5 weeks to 11 hours. Today, just under four out of five employees are not receiving on-the-job training at all.
At the same time, higher education institutions are hiring more IT and tech staff than ever before, with analytics-related roles such as programmers and system analysts accounting for nearly a quarter of new IT positions in 2018.
Across industries, the evidence indicates that most organizations are recognizing they no longer need to spend heavily on extensive training budgets, and are instead investing in specific, technical areas.
Why? Because using learner analytics to build and refine education programs gives designers clear insights on the most optimal content—what learners want, what teaching approaches they respond best to—as well as what parts of the program are not performing, and can, therefore, be cut.
Ready to make the same gains in your own organization? Start by watching our webinar on How To Utilize Data To Improve Operational and Learning Effectiveness.
The result is a more optimized, ROI-boosting eLearning course, which produces the same or better learning outcomes for less. Scroll down for three examples of how eLearning professionals are using data analysis in today’s educational environments.
4. Education analytics: three example uses
 |
| (source: Charles Deluvio, Unsplash). |
Education analytics example #1: Analytics reporting on individual learner progress
Simple data tracking and reporting can greatly increase the value of a student or employee review. When you know exactly where a learner is excelling, and where they need more help, it becomes possible to skip straight to the actionable part of the meeting.
Here, it’s all about knowing the most beneficial metrics for eLearning and why you should track them. If you’re looking at analytics across a classroom, you might try to identify at-risk learners—allowing you to intervene at an earlier stage and close widening attainment gaps within a cohort.
By aggregating reports, it’s also possible to build a pretty undeniable evidential case, which is valuable for use in the event of a more serious performance review.
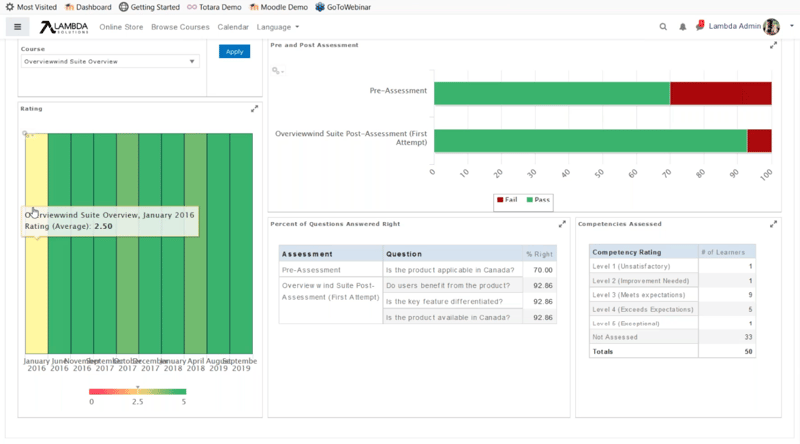 An example of a Lambda Analytics learner effectiveness dashboard. For instructors, dashboards can include info on course feedback, assessments, and competencies.
Education analytics example #2: Learning analytics for instructors
Nowadays, it’s common practice for instructors to run their own analytics reports, using their findings to improve their practice. Many institutions also support teachers with regular analytics updates, which provide a helpful diagnostic tool for identifying issues and informing future design.
When developing this type of data report, Lambda Analytics dashboards are probably the most engaging option. Each dashboard can speak to a different aspect of your program—filled with the most relevant data for a particular role, then shared wherever is easily accessible for instructors.
For example, a standard learner Effectiveness dashboard (see the image above) might include insights on course feedback, assessments, and competencies, month-to-month on a course. This information can then be embedded and updated periodically.
For this dashboard, a heatmap represents feedback over time, while pre- and post-course statistics are shown in a horizontal bar chart. But dashboards can combine any number of chart types and datasets—student subgroup comparisons, for example, such as BME or part-time students—whatever you need to help demonstrate how instructors’ approaches are playing out over time.
If you’re an instructor asking What Are The Most Important KPIs for LMS eLearning? you’ll probably want to check out this blog!
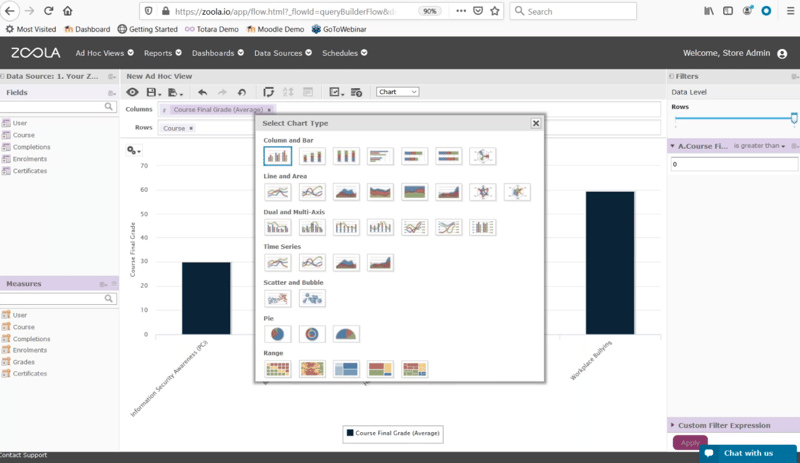
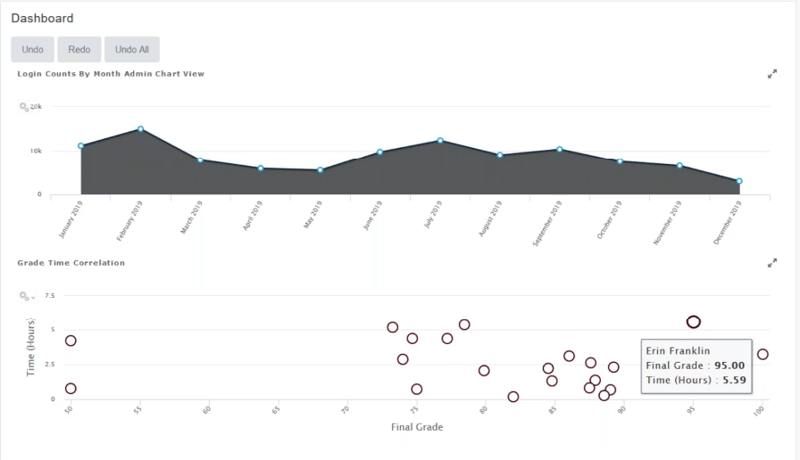
Use Lambda Analytics to select the chart type and format that will tell a persuasive data analytics story.
Education analytics example #3: Learning analytics for eLearning stakeholders
By now, it should hopefully be clear that analytics tools such as Lambda Analytics Dashboards have potential beyond a single KPI or learner objective.
The storytelling power of data analytics makes it one of the most effective ways of selling your education program to wider stakeholders. Isolated performance indicators—a single survey of student satisfaction, for example—can be difficult for people to meaningfully access, especially if they’re external to your institution. A full analytics report, on the other hand, lets you paint a vivid picture of learning by selecting any number of data points for presentation.
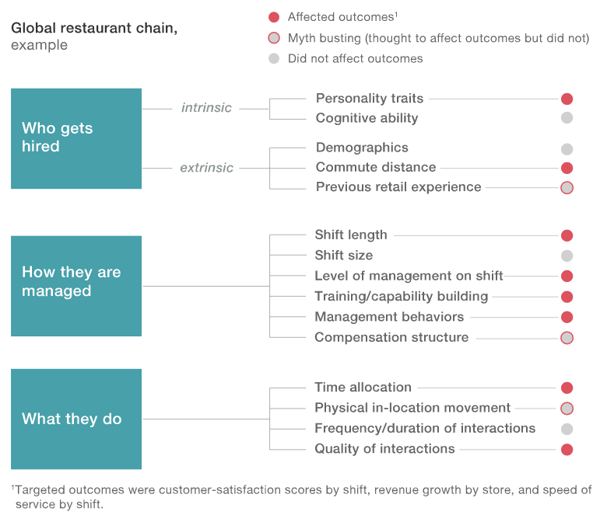 Analytics firm McKinsey&Company used people analytics to match employee features with desired retention outcomes (McKinsey&Company case study 2017, Using people analytics to drive business performance: A case study).
For management and eLearning stakeholders higher up the chain, predictive analytics can also be used to highlight faculty members and employees who may be at a higher risk of leaving their role.
Algorithms can compare known exit factors with data gathered through reviews, general performance, and qualitative surveys. The results then help highlight where attention and resources should be allocated in the hope of retaining the top teaching talent!
Keen to keep climbing down the Learning Analytics rabbit hole? Here’s what we’ve got for you:
-
eBook: LMS 101: Learning Analytics
-
eBook: The Practical Guide to Evaluating Your Workplace Learning Effectiveness
-
Webinar: How To Utilize Data To Improve Operational and Learning Effectiveness
-
Article: What Are The Most Important KPIs for LMS eLearning?
-
Article: The most beneficial metrics for eLearning and why you should track them
-
Article: Healthcare Analytics: Why Educators Are Using Blended Learning and Big Data in Healthcare
-
Article: Learning Analytics: The Art and Science of Using Data in eLearning

.svg)
%20(1).svg)